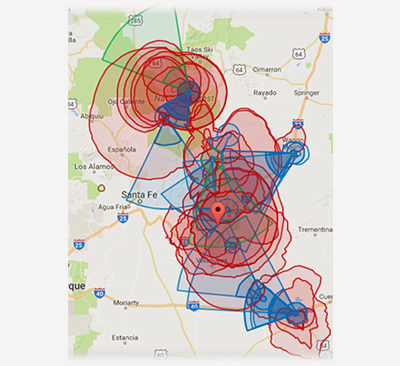
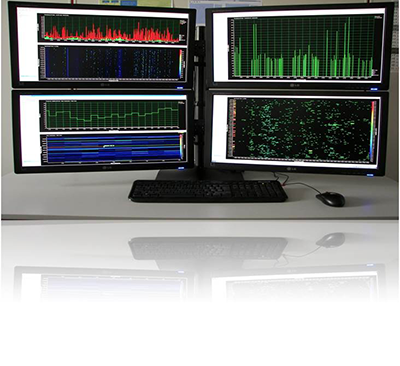
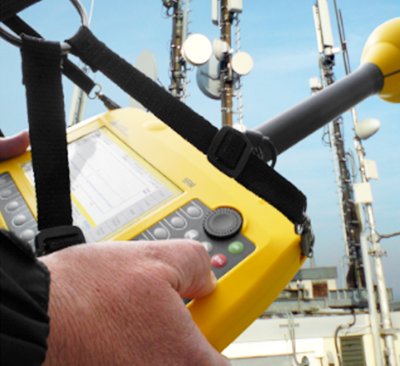
SpectrumMap is a cloud based big data system, which gathers real spectrum usage data from monitoring devices and presents it on a map in a fast, user-friendly way. The system utilizes spectrum data from many sources, such as fixed sites, temporary sites, mobile, handheld and portable devices. The LS OBSERVER monitoring units are ideally suited for the monitoring data collection, but also third party monitoring devices may be integrated and used.
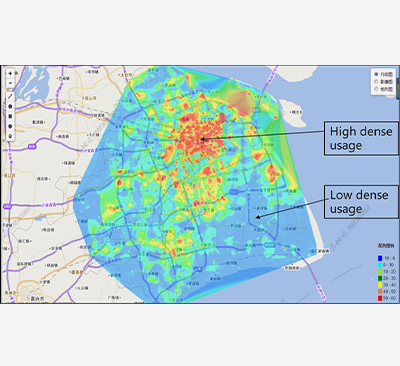
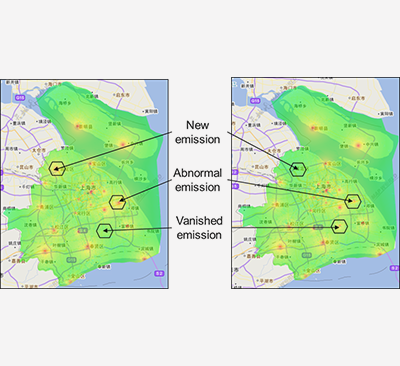
With the aid of the collected monitoring data, SpectrumMap builds an area wide spectrum usage map. A smart interpolation algorithm provides you with the expected signal level at each pixel of the underlying map. You do not need to remember which sensor is located in an area of interest. Also, there is no need for specifying complex queries in a huge data repository. SpectrumMap presents the data in a user-friendly manner in a web browser and supports efficiently spectrum analysis, verification of simulation results, detection of unlicensed emission and determination of spectrum over- and under-utilization. In addition, it serves as a profound basis for policy making.
Explore a new ways of spectrum usage visualization and reap the full benefits of your monitoring data.
Your LS telcom Contact
Contact us for further information
Phone: +44 (0) 203 576 2920
E-mail: Info(at)LStelcom.co.uk
